Multi-datasource monitoring with Prometheus, Loki, Tempo, and VictoriaMetrics
Query metrics, logs, and traces in one place so teams can debug issues faster.
100% open source observability
It solves scattered monitoring with one place to query Prometheus, VictoriaMetrics, Loki, and Tempo, with no paid tiers or license-gated features.
Ace is a truly open-source observability dashboard that gives teams one place for metrics, logs, and traces with no license-gated features.
Ace combines dashboards, querying, alerting, and access control in one open-source product with no paid-only features.
Query metrics, logs, and traces in one place so teams can debug issues faster.
Run Ace in your own environment and keep full control of your data and network.
Import existing Grafana JSON dashboards so you can move without rebuilding everything.
Create alerts from your queries and investigate the results in the same product.
Use Google or Microsoft SSO, manage members and groups, and apply admin, editor, and viewer roles.
Choose light or dark themes that keep dashboards readable during long sessions.
Use this table to compare Ace and Grafana for self-hosted teams evaluating open-source monitoring tools.
| Feature | Ace | Grafana |
|---|---|---|
| Deployment model | Self-hosted first with straightforward local setup | Cloud and self-hosted options with a wider set of products and plans |
| Source model | Truly open-source codebase with no paid-only features | Open-source core with enterprise and cloud offerings |
| Prometheus metrics | Native support for Prometheus-compatible metrics queries | Native support for Prometheus-compatible metrics queries |
| Loki logs | Integrated Explore flow for logs and related telemetry | Integrated Explore flow for logs and related telemetry |
| Tempo traces | Trace search and timeline views in the same interface | Trace support through Tempo integrations and trace views |
| Dashboard migration | Built-in Grafana conversion flow and YAML import path | Native format for existing Grafana JSON dashboards |
| Configuration as code | YAML export and import for easy review and repeatable setup | JSON export commonly used for dashboard portability |
| Organization access control | Admin, editor, and viewer roles are simple to apply | Role behavior varies by deployment and edition |
| SSO administration | Provider setup available in organization settings | Provider setup depends on deployment mode and edition features |
| Operational scope | Focused product centered on monitoring and incident debugging | Broad ecosystem with many plugins and product extensions |
Ace is a strong fit for teams that want truly open-source, self-hosted monitoring with metrics, logs, traces, and access control in one product. Grafana remains a mature option with a larger plugin ecosystem.
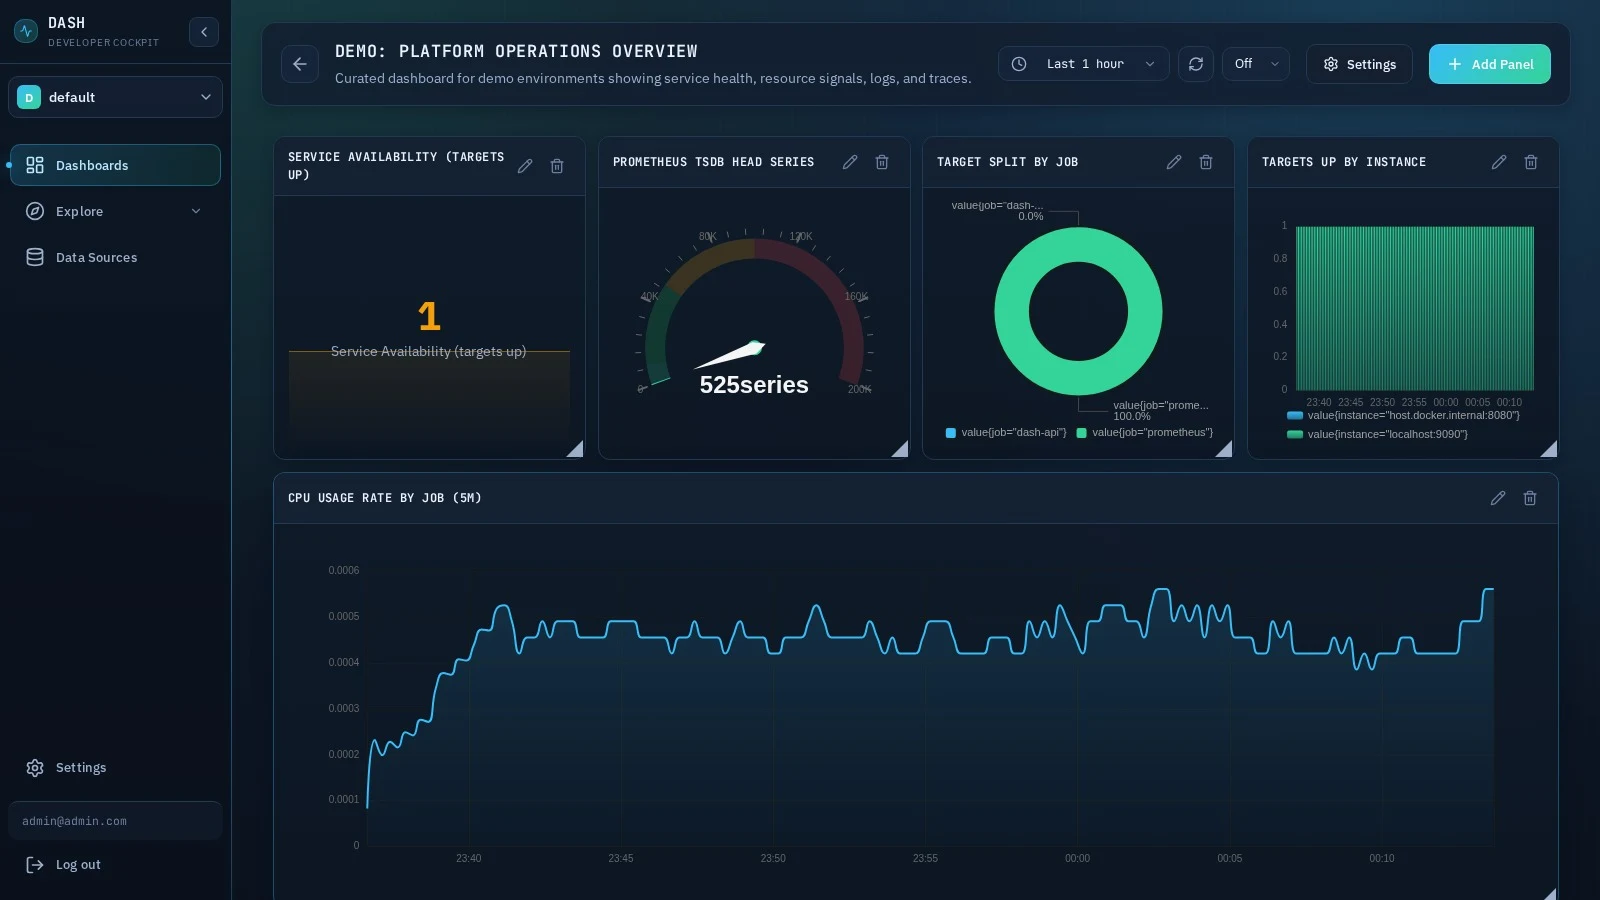
See Ace in action across dashboards, datasource setup, query editing, alerts, and organization settings.


Start with a truly open-source dashboard for metrics, logs, and traces, with no paid tiers or license-gated features.


